The roadmap is generated evidence with a human explanation
Every tracked item has one status and one planning tier. Those facts feed the dashboard below and a dated HTML snapshot. The page around them explains why the work is ordered that way. Raw work-item titles and repository identifiers stay private; a completed item appears by name only when I have written a separate public description for it.
That split fixed a recurring problem. A hand-written roadmap could tell the story well, but its counts and recently delivered work drifted as soon as the next change merged. Generating the whole page would keep the numbers current and flatten the writing. I now automate the facts and keep the judgment human.
Built from the tracked backlog, public-description allowlist, roadmap generator, publication scrub, live dashboard, freshness check, and dated dashboard-count incident.
The live dashboard answers whether the plan is moving
The first row is the quick read: total tracked work, completed work, and the overall completion percentage. The dashboard then carries progress by tier, issue themes, learning mix, and recently delivered outcomes. Together, those panels show whether the foundations and current operational work are moving, what kind of work is consuming the plan, and which recognizable engineering results changed most recently.
Live roadmap dashboard
Checking the live view.
The live view is unavailable. The generated delivery snapshot below remains readable and carries its own as-of date.
Total and completed work
Use these together. A growing total with a growing completed count can be healthy; a percentage alone hides that the plan also changed.
Progress by tier
Now, Next, and Later are dependency groups, not promised dates. The panels show whether the base is stable before more advanced work is pulled forward.
Themes and learning
These group items into engineering concerns so a long backlog can be read as investments rather than a pile of tickets.
Delivered outcomes
Only completed items with a reviewed public sentence appear. No description means the item affects counts but contributes no public text.
How private work becomes a public roadmap
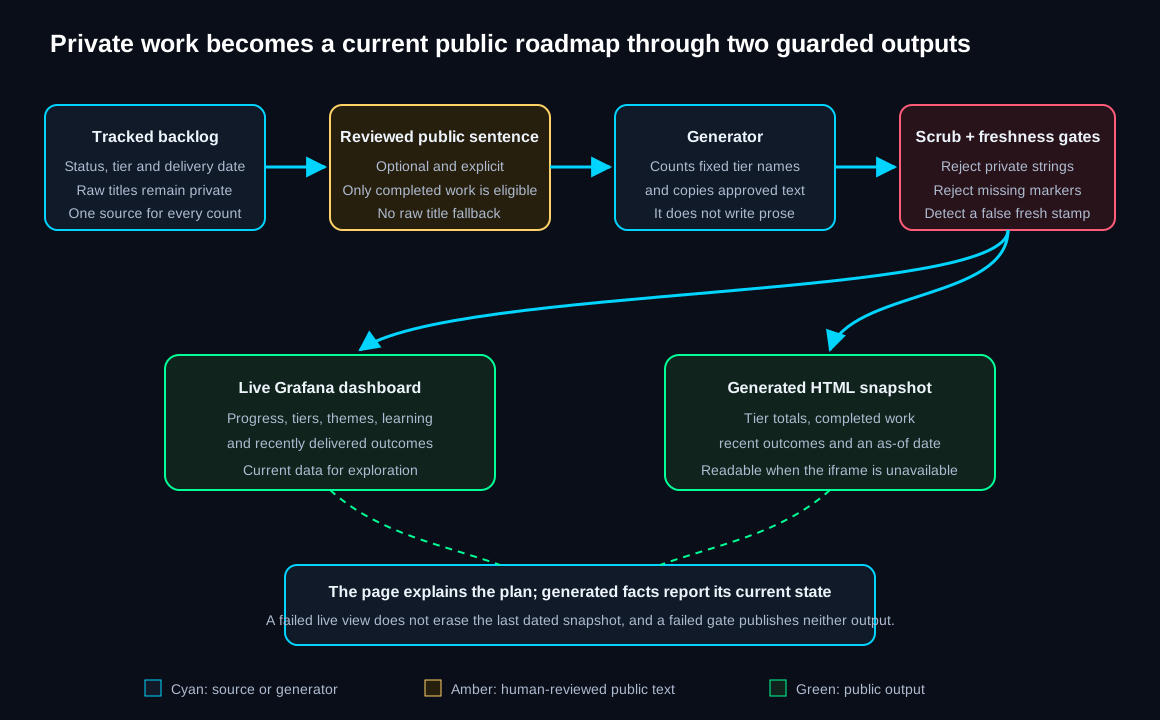
The tracked backlog is the authority for status, tier, and delivery date. The generator may count every valid item because integers do not reveal the item’s name. It may publish text only from an explicit public field on a completed item. There is no fallback to the raw title.
The public field is an allowlist: the author has to write it for publication. A separate scrub then rejects known private strings across the complete staged site. The controls have different jobs. The allowlist limits which text is eligible; the scrub catches a mistake inside eligible text.
The generator writes two public shapes. Prometheus series feed the Grafana dashboard for exploration. A marked block in this page receives a dated tier summary and recent outcomes. If the live dashboard cannot load, the reader still gets the last generated snapshot rather than a blank promise.
Now, Next, and Later describe dependency, not a deadline
- Now
- Foundation work that other systems assume exists: repeatable provisioning, configuration from Git, merge gates, shared pipeline behavior, current dependencies, runbooks, and recovery proof. A foundation moves out of Now when later work can safely depend on it.
- Next
- Use that base for unified observation, coverage audits, repair proposals, morning triage, reporting, restore verification, credential lifecycle, and the internal interfaces that connect those paths.
- Later
- Work that needs more evidence before it deserves autonomy: right-sizing, controlled failure experiments, paved-road platform products, and remediation that graduates from suggestion to gated action only after its outcomes are measurable.
Moving an item between tiers is a planning decision. Completing it is an evidence decision. The roadmap does not close work because the code exists; the definition of done can also require tests, operator guidance, a live run, monitoring, and a safe failure path.
The fallback is generated from the same tracked work
261 open items · 315 completed
Delivery snapshot, generated from the backlog - as of 2026-09-08.
Population: 573 of 576 backlog items carry a tier label; only tier-labelled items are counted above.
Recently delivered
- 1 item closed (2026-09-08)
- 2 items closed (2026-09-07)
- 1 item closed (2026-09-06)
- 5 items closed (2026-09-04)
- 6 items closed (2026-09-02)
- 11 items closed (2026-09-01)
- 5 items closed (2026-08-31)
- 10 items closed (2026-08-30)
The as-of date is part of the evidence. It tells the reader when the fallback was produced instead of letting old values look current. A freshness checker compares that date and the newest delivered item with the backlog and can detect a date that advanced while the rendered data stayed unchanged.
How it runs now
| When | What runs | What happens next |
|---|---|---|
| When tracked work changes | The backlog remains the single status and tier source. A public sentence is optional and must be written explicitly. | Counts can change; public prose changes only when reviewed prose exists. |
| When a change merges | The site sync detects backlog or site changes and regenerates the staged roadmap before publication. | The completing merge can update the public facts without a second page edit. |
| Before publication | The generator validates its markers and eligible fields, then the site scrub examines the complete staged output. | A parse error, missing marker, or rejected private string stops publication. |
| While the live view is healthy | Grafana reads reduced roadmap metrics and renders progress, tier, theme, learning, and recent-delivery panels. | The reader can explore current state without receiving the private issue source. |
| When the iframe is unavailable | The page leaves the live frame hidden and displays the generated snapshot. | The roadmap remains useful, and the snapshot date makes its age visible. |
| On the daily assurance check | The freshness checker compares page dates, delivered work, and optionally a previous data hash. | A false fresh stamp is reported instead of being accepted as current evidence. |
What broke while I was building it
2026-07: the hand-written roadmap lagged the work
A state audit found that the strategy page trailed execution by roughly one to two months and omitted shipped work. It did not falsely claim unfinished work was complete, but it was no longer a dependable current-state view.
The fix was not more reminders to edit the page. The tracked backlog became the source for counts and delivered dates, while the page kept only the explanations that benefit from human writing.
2026-07-26 to 2026-07-27: completed-work panels stopped increasing
The dashboard counted one API page instead of the result total. Once completed work exceeded that page size, the panel stayed pinned even while more work closed. The first attempted fix used datasource pagination and turned the wrong number into a server error because that plugin path could not merge the empty final page.
The working correction used one page sized above the population and raised the matching server limit. Diagnosis also found a duplicate API configuration section, so the value that looked correct was not the only value being parsed. Tests now pin the dashboard query shape, but the design still needs the page and server limits raised together before the population reaches the current ceiling.
What I would do differently
I would separate strategic prose from delivery state on day one. A narrative document is good at explaining why; it is a poor database for what closed this morning.
I would also test dashboard queries at their data boundaries before the counts approached them. The panel looked reasonable until it saturated, which is exactly why returned-row count and server-reported total should have been compared from the beginning.
If I were recreating this from scratch
- Choose one machine-readable work source. Status, tier, and delivery date should never be recopied into a page.
- Separate facts from judgment. Generate counts and dates; write the planning explanation.
- Make public text opt-in. Never publish a raw private title when an approved description is absent.
- Build both outputs from the same source. The live dashboard and HTML fallback should disagree only if one pipeline is broken.
- Put the as-of date in the page. Staleness should be visible before an assurance job reports it.
- Test the ceiling. Query limits, pagination, and server clamps need fixtures above the expected population.