How I made a missing job loud
Daily digests and recovery tests have to report that they ran. A scheduled checker reads the age of the last successful completion and pushes that age to Zabbix. One alarm catches work that has gone stale; another catches the checker itself when it stops pushing.
The design keeps the shared operations database private inside Kubernetes. The checker runs where it can already reach that database and pushes two small age values outward. Prometheus watches the Zabbix virtual machine from a separate monitoring plane, so the dead-man switch does not depend entirely on the system it is checking.
Built from the digest dead-man decision, sender pipeline, committed Zabbix item and trigger specification, NOC reconciler, recovery heartbeat, and watcher-of-the-watcher rule.
A job that never starts may never report an error
A backup digest that runs and finds a stale backup can send an alert. A digest that never runs sends nothing. The inbox looks the same as it would after a quiet night, and the absence can continue until someone notices that the expected message has been missing.
The same blind spot applies to the morning operations summary, the public-dashboard reconciler, and the weekly restore test. Each exists to report on another system. If the reporting job or its scheduler disappears, the monitored system can look healthy because no new result arrived to disagree.
I treat completion as a piece of monitoring data. A job records when its useful work finished, and a separate process reports how old that completion is. The alarms are based on that age and on whether the separate process is still speaking.
The heartbeat records completion, not email arrival
The AIOps digest writes one database row for each actual send. Preview runs are excluded. The backup digest gained a separate heartbeat table and records its status and finding counts immediately after the email is sent.
I considered watching the mailbox for a subject line. That would mix together several failures: the job, SMTP delivery, mailbox rules, IMAP access, subject wording, and timezone windows. A database heartbeat answers the narrower question the control needs: did the digest complete and send?
The shared database is available only inside Kubernetes. Exposing it to the Zabbix server for two read-only queries would add a routable listener, database role, stored password, driver, firewall rule, and maintenance path around a store that also carries infrastructure state. I inverted the check instead.
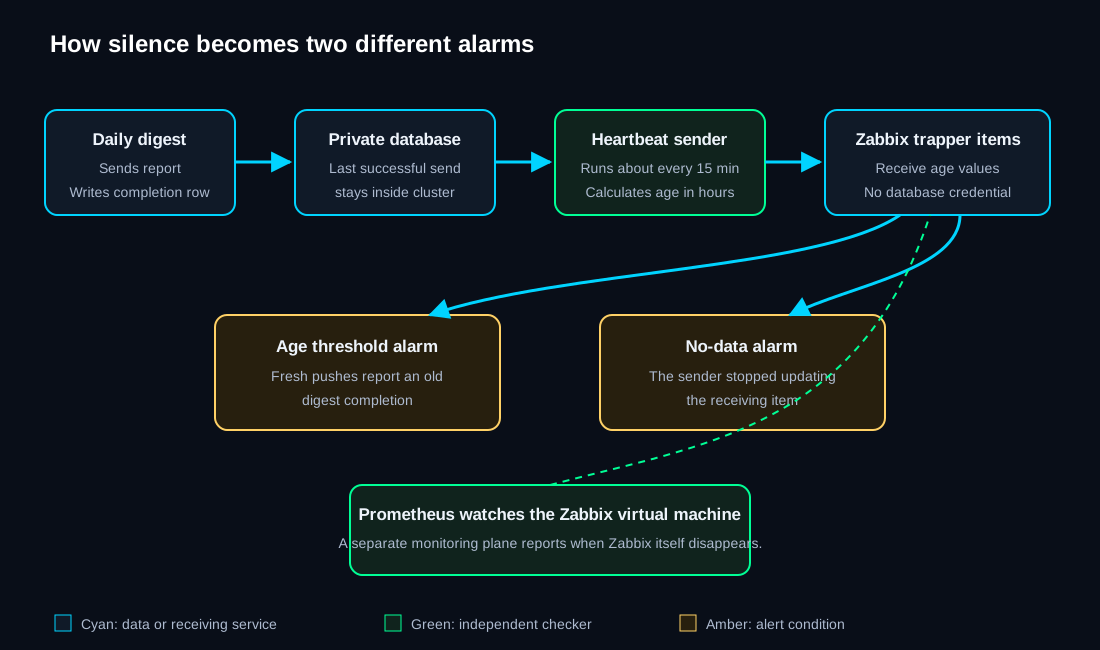
The five-step heartbeat path
- A digest completes its useful work. The successful send writes a timestamp and small status fields to its heartbeat table.
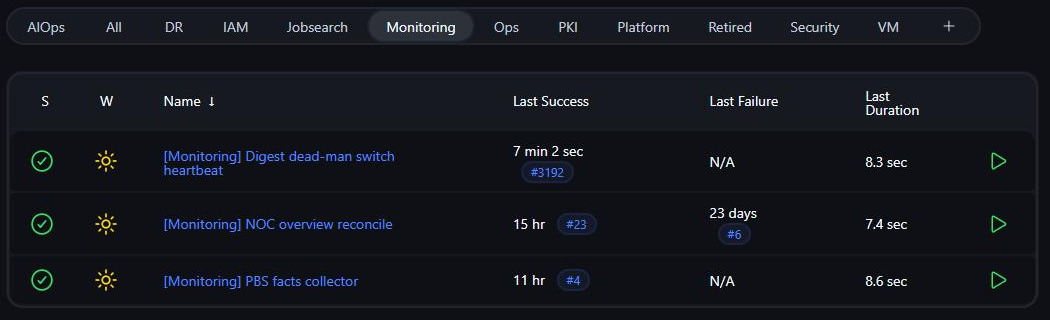
- A separate Jenkins job wakes roughly every fifteen minutes. It runs on an in-cluster agent that already has network access to the database.
- The sender calculates age. It reads the most recent successful row for each monitored digest and converts elapsed time into hours. A missing table row becomes an intentionally large age, not an empty success.
- The sender pushes the ages to Zabbix trapper items. A trapper item is a mailbox for a value another process sends. Zabbix does not need database access.
- Zabbix evaluates two kinds of trigger. An age threshold catches missed work. The built-in
nodata()function catches a sender that stopped updating the item.
The checker is designed to fail loudly
The digest itself treats heartbeat recording as fail-soft. If email was sent and the heartbeat database is temporarily unavailable, the digest logs a warning without converting a delivered report into a failed delivery. The separate heartbeat sender has the opposite behavior. A database error, query error, or failed Zabbix push exits nonzero and turns the Jenkins build red.
That difference preserves both signals. The digest reports whether the report was delivered. The sender reports whether monitoring can still read and publish completion age.
Each digest item has a long threshold and a short no-data threshold. The long threshold is a full daily cycle plus grace, around 30 hours, so a slightly late schedule does not alert. The short threshold is about two hours, which is long compared with the fifteen-minute sender schedule and therefore identifies a stalled checker.
Fresh push, old completion
The sender is alive. The value it just reported says the digest missed its daily run. The alert names the digest.
No recent push
Zabbix has no current statement from the sender. The alert names the dead-man checker or its Jenkins path.
Prometheus watches the machine running Zabbix
A Zabbix trigger cannot send mail when the Zabbix server itself is down. A separate Prometheus rule watches the virtual machine that runs it. That leaves two monitoring planes with different failure paths.
If the Jenkins sender stops while Zabbix remains up, the Zabbix no-data trigger fires. If Zabbix disappears while Prometheus remains up, Prometheus alerts on the missing virtual machine. A complete lab and internet outage is outside that internal pair, which is why an external heartbeat service remains the next escalation if full-site outage detection is required.
Planned maintenance uses Zabbix maintenance periods and Alertmanager silences. The age threshold already includes schedule grace, so routine jitter does not need a silence.
The same pattern protects the public NOC definition
The public NOC is generated from registered domains and dashboard definitions. It can still drift after deployment if someone changes Grafana by hand or if a route is retired without updating the hub.
A nightly reconciliation job rebuilds the expected dashboard and compares it with the live Grafana definition field by field. It checks panels, queries, links, thresholds, color steps, variables, and dashboard settings. The job reports the first differences and pushes its own current result. A drift trigger catches disagreement; a no-data trigger catches a reconciler that stopped running.
The reconciler found actual differences during development, which is why the comparison reports the panel and field rather than a generic drift flag. That makes the morning alert actionable without opening every dashboard.
Restore verification sends a different kind of heartbeat
The weekly recovery pipeline restores a protected guest into an isolated network, runs operating-system and service checks, destroys the scratch copy, and records the outcome. Its heartbeat means more than “the scheduler woke up.” It is written after the restore and verification path completes.
If that heartbeat ages out, the system no longer claims that recovery is being exercised. A backup dashboard can remain green while a restore job has silently stopped, so the recovery heartbeat is displayed and alerted separately from backup freshness.
How it runs now
| When | What runs | What a quiet result means |
|---|---|---|
| After each daily digest | The delivery path writes a completion row after the email send. | The next age calculation will return to near zero. |
| Roughly every fifteen minutes | Jenkins reads completion ages and pushes trapper values to Zabbix. | The sender, database read, network path, and Zabbix item accepted the update. |
| Continuously in Zabbix | Age and no-data triggers evaluate the latest items. | Both the monitored work and the checker are within policy. |
| Nightly | The NOC reconciler compares generated intent with live Grafana. | The served dashboard still matches the repository definition. |
| Weekly | The recovery pipeline sends completion evidence after restore and teardown. | The scheduled recovery path still produces a usable guest and cleans it up. |
| Continuously in Prometheus | A separate rule watches the Zabbix virtual machine. | The monitoring plane that owns the dead-man triggers is reachable. |
What broke and what remains limited
The first design could not reach its database
The initial plan put an ODBC query on the Zabbix server. The database had no routable address outside Kubernetes. Creating one solely for two timestamps would have expanded the attack surface around a shared high-value store. The design changed to an in-cluster read and an outbound trapper push.
A missing first run is intentionally noisy
When a registered heartbeat has no row, the sender reports a very large age. That can raise an alert immediately after activation. The correction is to run the producer and create the first successful evidence, not to widen the threshold until the unknown state looks healthy.
A full-site outage still needs an outside observer
Zabbix and Prometheus cover one another while at least one internal monitoring plane is alive. They cannot notify from a site with no power or internet path. An external dead-man service is the design option for that failure boundary.
If I were recreating this from scratch
- Define what completion means. Record the timestamp after the report, restore, or reconciliation actually finishes, not when its scheduler starts.
- Store a small status record. Keep the timestamp and useful counts. Do not use email delivery as the primary evidence source.
- Read the heartbeat from the network zone that already owns access. Avoid exposing a database merely to make monitoring topology convenient.
- Push age to a receiving item. Use separate items for each job so an alert can name the missing producer.
- Create age and no-data alarms. One watches the work. The other watches the watcher.
- Put the monitoring server under another plane. A dead-man switch hosted by one system needs a second system to report that host's disappearance.
- Test missed work and a stopped sender separately. They should produce different alarms and recovery instructions.