InputsThe exact data it reads
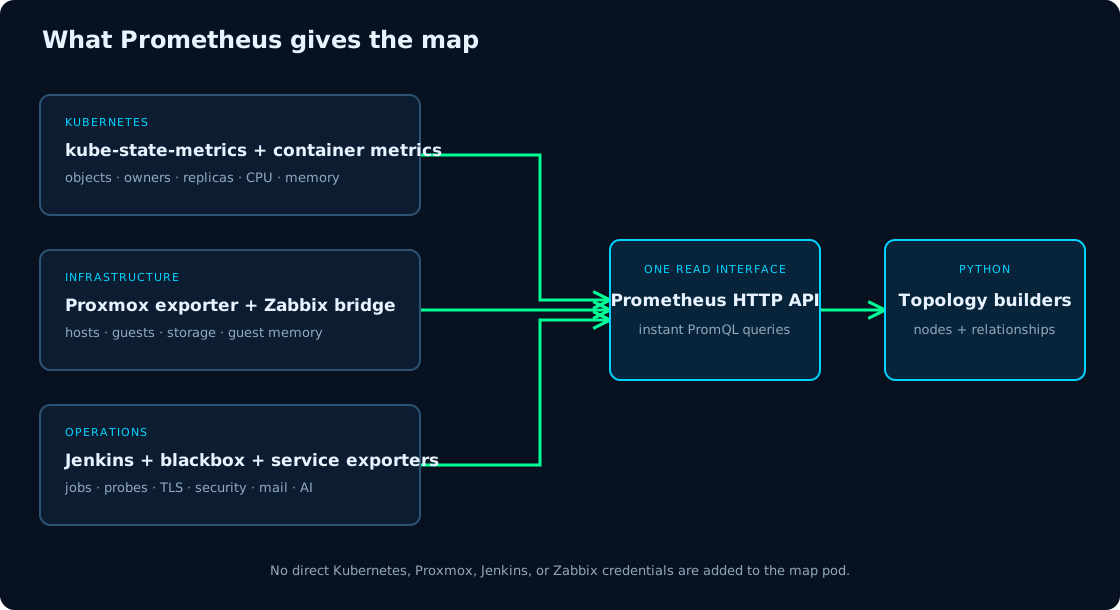
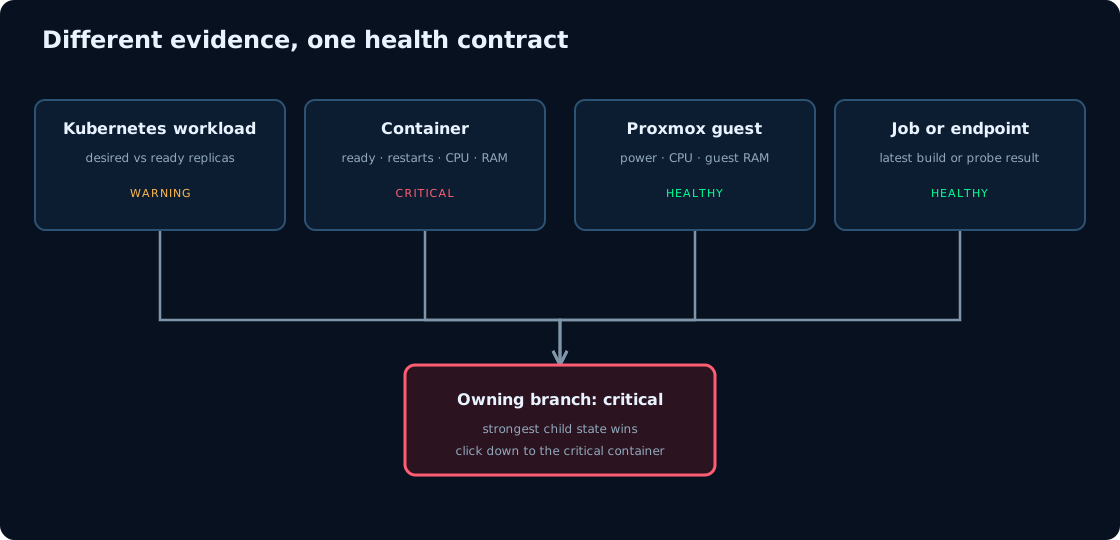
For Kubernetes, kube-state-metrics supplies namespaces, nodes, Deployments, StatefulSets, DaemonSets, Jobs, ReplicaSets, pods, containers, Services, Ingresses, and persistent volume claims. Container metrics add CPU and working-set memory. Resource metrics add requests and limits.
For infrastructure, the Proxmox exporter supplies hypervisors, guests, placement, CPU, allocated memory, disks, storage, and uptime. Zabbix-derived metrics add memory observed inside each guest so the map does not mistake allocated RAM for pressure.
Jenkins metrics supply job results, durations, queue depth, wait time, and executor capacity.
Blackbox exporter is a small Prometheus exporter that runs as one pod in the monitoring namespace. It does not scrape anything on its own. Prometheus asks it to probe a target on a schedule, naming the target and the probe type: an HTTP request, a TCP connect, a TLS handshake, a DNS lookup, or an ICMP ping. The exporter performs that probe from inside the cluster and answers with metrics: whether the probe succeeded, how long it took, the HTTP status, and for TLS the expiry of the certificate the service actually presented. The map uses those results as the health of every service endpoint and every network segment, so the color of an endpoint comes from a real connection made seconds ago, not from whether a pod exists.
Additional exporters expose cert-manager expiry, Entra credential expiry, Vault state, Wazuh collector freshness, backup storage, mail delivery, and AI gateway budgets.