Actionable
The evidence supports a concrete next step. The report explains why it matters and gives a diagnostic starting point. It still does not execute the step.
Last run 2026-09-21 · 45 findings · 3 actionable · 41 needs info · 1 known noise
Before I start work, one read-only job checks alerting, monitoring, failed automation, and backups, then sends a report that separates work to do, questions to investigate, and noise already understood. The report names any source it could not read, keeps the evidence that produced each decision, and cannot make a change to the environment. The result is a short attention list instead of a morning spent opening consoles and reconstructing the same timeline by hand.
AIOps is the use of software and machine-assisted analysis to reduce operational signals into decisions a person can review. In this project it means collecting evidence, applying repeatable rules, asking a language model to explain ambiguous cases, and stopping at a report.
Built from the current collectors, database migrations, deterministic correlation and disposition code, local-first classification path, Jenkins orchestration, production email template, public Grafana view, and the incident that proved a missing run needs its own alarm.
I designed the email first because it is the part a person has to trust. The top line says whether collection and triage ran cleanly. The next line gives the measured finding totals for that run. The body then leads with the item that deserves action, keeps incomplete evidence in a separate needs-info section, and leaves suppressed noise visible enough to audit without letting it dominate the morning.
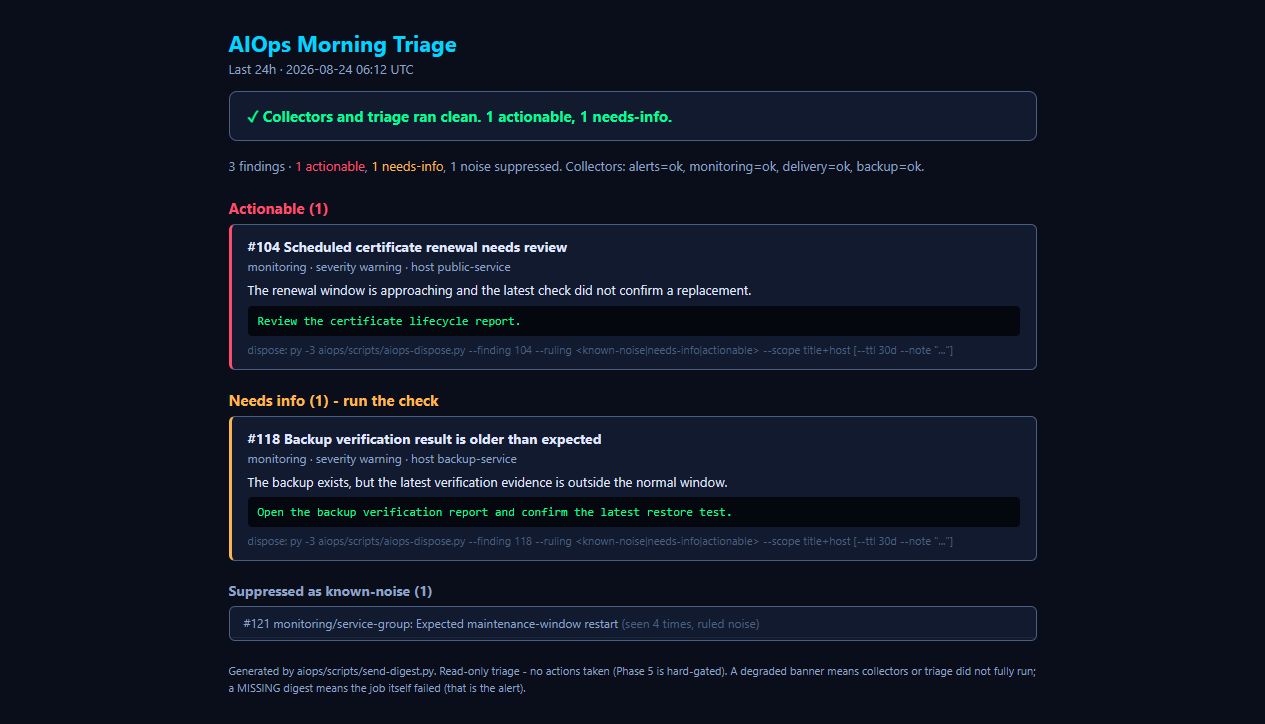
The evidence supports a concrete next step. The report explains why it matters and gives a diagnostic starting point. It still does not execute the step.
The signal may matter, but a source is stale, context is missing, or the classification is not trustworthy enough to recommend action.
History or an operator ruling identifies a recurring non-actionable condition. Critical new evidence can override that suppression and return the item to view.
The three outcomes are not model moods. They are stored classifications with a rationale, confidence, engine, prompt version, source finding, and run identifier. That history makes a later report explain whether the same signature has appeared before and whether a person has already ruled on it.
I now switch between ChatGPT and Claude subscriptions based on which eligible provider has the most usage remaining. Ollama still handles the first classification locally; hard cases can receive a second opinion through the subscription router. There is no metered API fallback.
The router compares weekly usage remaining after setting aside each provider's reserve for interactive work. The five-hour allowance breaks a tie. Failed, stale, incomplete, or reserve-breaching usage observations make a provider ineligible.
How to read it: the gauges show weekly and five-hour usage remaining for each provider. The pace charts compare weekly allowance with the rate needed to last until reset. These are subscription percentages, not API costs, and they do not prove that a triage run completed.
Checking the live subscription-usage dashboard.
The live subscription-usage dashboard is unavailable. No cached usage is presented as current.
The public view contains aggregate provider usage. Finding text, prompts, host identities, and management links remain private.
Run health is tracked separately. Each collector writes a private run heartbeat before it asks its source for findings. A current heartbeat with zero findings means the source was reached and the period was quiet. A missing or stale heartbeat means the evidence was never gathered. That distinction cannot be inferred from an empty chart.
Jenkins, the automation server, starts the job on a daily schedule after the backup window and before the workday. It launches an ephemeral Kubernetes agent, a short-lived container with the Python libraries and runtime identity the chain needs. The agent checks out the reviewed repository, reads narrowly scoped credentials from Vault, reaches the source systems, and writes the normalized result to PostgreSQL.
Every arrow moves data, not authority. The job can read source systems, write its own evidence store, and send a report. It has no path back from a classification to an operational change.
The Prometheus alert router supplies alerts that are firing now. Its fingerprint becomes the stable identity. It does not claim to reconstruct alerts that fired and resolved before collection.
The infrastructure monitoring system supplies problem events and whether each one is still active. The collector maps source severity into the common vocabulary and keeps the original tags as evidence.
The automation server exposes failed, unstable, or aborted builds in the reporting window. The collector walks jobs and nested folders. A build is recorded as work awaiting triage, not as a live infrastructure alert.
The backup platform supplies stale and failed guest results through the same code used by the backup report. Healthy guests do not become findings.
A normalized finding keeps the source-native identifier and a trimmed raw payload. Normalization makes the records comparable without pretending they are identical. A failed build and an active host alert can share a host and a time window, but the original source evidence remains available when the report needs to explain the difference.
The pipeline does not send an unfiltered event dump to a model. Deterministic code creates a signature from the source identity, updates an existing finding when the same event is collected again, and groups findings that share a host. It also loads classification history and active operator dispositions before any inference runs.
Read alerts, problems, builds, and backup health. Write findings, run records, classifications, dispositions, and digest heartbeats to the AIOps database. Send HTML mail.
No shell, deploy, restart, acknowledge, delete, ticket-closing, or pull-request action is reachable from a model classification. Suggestions remain text for a person to review.
The model is inside the analysis path, not the control path. Vault policies and the job design give collectors read access to their sources. The only writes are to the dedicated evidence database and the mail system.
| Component | Where it runs | Responsibility | Failure posture |
|---|---|---|---|
| Jenkins | Kubernetes controller and an ephemeral job agent | Schedules the run, orders collection, triage, and digest stages, keeps logs, and marks partial source failures unstable. | Collector or triage failures do not block the digest. A digest failure fails the job because a missing report is the alarm. |
| Collectors | Python processes in the job agent | Use read-only APIs to gather alerts, monitoring events, CI results, and backup health, then normalize them. | Each records its own running, ok, or error row. An unreachable source cannot look like a quiet source. |
| PostgreSQL | A dedicated AIOps database | Stores findings, collector runs, classifications, triage runs, digest runs, operator dispositions, and retained history. | A database failure makes the evidence chain untrustworthy and prevents a normal digest. |
| Vault | Central secrets manager | Issues the job’s runtime identity and supplies read-only source credentials plus the mail credential. | A missing credential fails the source that needs it. Values are not placed in the repository or the report. |
| Ollama | A local inference host | Classifies the common path without a metered API credential. | If it is unavailable, triage records its own failure finding and the digest reports that triage did not run. |
| Headless second-opinion router | The same job agent, using installed subscription-backed clients | Reads fresh usage observations, protects interactive reserves, and selects an available provider only for a hard case. | Stale or exhausted measurements fail closed. There is no automatic metered API fallback. |
| Mail service | The existing authenticated SMTP path | Sends the rendered report after collection and triage state have been assessed. | A send failure fails the digest stage. The absent morning email is intentionally treated as a signal. |
| Prometheus and Grafana | The monitoring stack | Track job status, activity, source freshness, shared service health, and public aggregate evidence. | Freshness alerts catch a chain that goes silent even when no Jenkins failure notification was produced. |
| When | What runs | What a person sees |
|---|---|---|
| On the daily schedule | The source collectors run in sequence, triage classifies new evidence, and the digest renders and sends. | One email arrives before the workday with collector health and the prioritized findings. |
| When one source fails | That collector records an error and the Jenkins build becomes unstable, but the remaining collectors and digest continue. | The report is marked degraded and names the missing source. Existing evidence is not presented as a fully healthy run. |
| When the local model fails | The triage run records an error and creates a stable finding about the triage engine. The job still proceeds to the digest. | The report says triage did not run. It does not reinterpret an empty classification table as no work. |
| When report delivery fails | The digest stage fails instead of being softened to unstable. | No report arrives, and the normal Jenkins failure notification becomes the signal to investigate the reporting path. |
| When a source heartbeat becomes stale | A separate freshness check compares the latest run record for every expected collector with the daily-run threshold. | An attention alert names the stale or absent source. This catches silence even if the job history itself looks inconclusive. |
| On a manual preview | The job renders the report from existing database state and archives the HTML without collecting, classifying, or sending. | A reviewer can inspect the exact template and data grouping without changing source or evidence state. |
Every configured collector stopped writing run records at the same timestamp. Because they failed together, the evidence pointed to one chain-level problem rather than independent source failures. The daily job produced no new collection evidence for nineteen days, and nothing alerted on the silence.
The gap was discovered while reading the live database for another task. That exposed the larger design failure: monitoring the Jenkins build was not enough. The system needed to ask whether each collector had written a recent run record, because a healthy quiet run still writes one.
A source-by-source freshness check now reads the latest collector-run timestamp. It distinguishes current, stale, absent, and unreadable states and sends an attention report when the evidence is old. One fresh source cannot hide the others. The original incident record remains honest that the historical stop’s exact Jenkins-side cause was not proven from repository evidence alone.